
Office Depot Announces First Quarter 2018 Results
Q1 2018 Reported Sales of
Services Revenue Increases to 14% of Reported Sales
Business Solutions Division (BSD) Returns to Growth
Q1 2018 Operating Income of
Q1 2018 Operating Cash Flow of
Increases Full-Year Outlook for 2018
| Consolidated (in millions, except per share amounts) | 1Q18 | 1Q17 | ||||||
| Selected GAAP measures: | ||||||||
| Sales | $2,830 | $2,676 | ||||||
| Sales change from prior year period | 6% | |||||||
| Operating income | $77 | $124 | ||||||
| Operating income margin | 2.7% | 4.6% | ||||||
| Net income from continuing operations | $33 | $74 | ||||||
| Earnings per share from continuing operations | $0.06 | $0.14 | ||||||
| Operating Cash Flow (1) | $207 | $88 | ||||||
| Selected Non-GAAP measures: (2) | ||||||||
| Adjusted operating income | $93 | $148 | ||||||
| Adjusted operating income margin | 3.3% | 5.5% | ||||||
| Adjusted net income from continuing operations | $45 | $88 | ||||||
| Adjusted net earnings per share from continuing operations (most dilutive) | $0.08 | $0.16 | ||||||
| Free Cash Flow (1) (3) | $170 | $58 | ||||||
(1) Both operating cash flow and Free Cash Flow are for continuing operations
(2) Adjusted results represent non-GAAP measures and exclude charges or credits not indicative of core operations and the tax effect of these items, which may include but not be limited to merger integration, restructuring, acquisition costs, asset impairments and executive transition costs. Reconciliations from GAAP to non-GAAP financial measures can be found in this release as well as on the Investor Relations website at investor.officedepot.com.
(3) As used throughout this release, Free Cash Flow is defined as cash flows from operating activities of continuing operations less capital expenditures.
"I am extremely pleased that we continue to see positive momentum in our core businesses and delivered financial results in the first quarter which, although lower than the prior year, exceeded our recent outlook," said
Consolidated Results
Reported (GAAP) Results
Total reported sales for the first quarter of 2018 were
| Sales Breakdown (in millions) | 1Q18 | 1Q17 | |||||||||||||||
| Product sales | $2,423 | $2,460 | |||||||||||||||
| Sales change from prior year | (2)% | ||||||||||||||||
| Service revenues | $407 | $216 | |||||||||||||||
| Sales change from prior year | 88% | ||||||||||||||||
| Total sales | $2,830 | $2,676 | |||||||||||||||
In the first quarter of 2018,
Adjusted (non-GAAP) Results (2)
Adjusted results for the first quarter of 2018 exclude charges and credits totaling
- First quarter 2018 adjusted operating income was
$93 million compared to an adjusted operating income of$148 million in the first quarter of 2017. These amounts include a negative impact for the recent change in pension accounting standards of$2 million in the first quarter of 2018 and$3 million in the first quarter of 2017. - First quarter 2018 adjusted net income from continuing operations was
$45 million , or$0.08 per diluted share, compared to an adjusted net income from continuing operations of$88 million , or$0.16 per diluted share, in the first quarter of 2017.
(2) Adjusted results represent non-GAAP measures and exclude charges or credits not indicative of core operations and the tax effect of these items, which may include but not be limited to merger integration, restructuring, acquisition costs, asset impairments and executive transition costs. Reconciliations from GAAP to non-GAAP financial measures can be found in this release as well as on the Investor Relations website at investor.officedepot.com.
First Quarter Division Results
Business Solutions Division
Business Solutions Division reported sales were
| Business Solutions Division (in millions) | 1Q18 | 1Q17 | |||||||||||||||
| Sales | $1,328 | $1,315 | |||||||||||||||
| Sales change from prior year | 1% | ||||||||||||||||
| Division operating income | $55 | $58 | |||||||||||||||
| Division operating income margin | 4.1% | 4.4% | |||||||||||||||
Business Solutions Division operating income was
Retail Division
Retail Division reported sales were
| Retail Division (in millions) | 1Q18 | 1Q17 | |||||||||||||||
| Sales | $1,244 | $1,358 | |||||||||||||||
| Comparable store sales change from prior year | (4)% | ||||||||||||||||
| Division operating income | $72 | $112 | |||||||||||||||
| Division operating income margin | 5.8% | 8.2% | |||||||||||||||
Retail Division operating income was
During the first quarter of 2018, the Company closed 2 stores and ended the quarter with a total of 1,376 stores in the Retail Division.
CompuCom Division
CompuCom Division results are only included in total Company results for the first quarter of 2018, as this business was not part of
| CompuCom Division (in millions) | 1Q18 | 1Q17 Historical (4) | ||||||||||||||||
| Sales | $257 | $259 | ||||||||||||||||
| Sales change from prior year | (1)% | |||||||||||||||||
| Division operating income | $5 | $6 | ||||||||||||||||
| Division operating income margin | 2.0% | 2.3% | ||||||||||||||||
CompuCom Division operating income was
(4) The CompuCom unaudited adjusted historical results for the first quarter of 2017 reflect information prepared prior to our acquisition and have not been subject to audit or the Company's internal control processes. Results have been adjusted for historical restructuring and acquisition costs and have been presented for reference purposes only. The results for 2017 may not be comparable to current year results nor indicative of the results of future operations of the CompuCom Division or the results that would have been attained had the acquisition been completed on
Corporate and Other
Corporate includes support staff services and certain other expenses that are not allocated to the Company's operating divisions. Unallocated expenses increased to
The Company's retained sourcing and trading operations in
As previously announced, during the first quarter
Balance Sheet and Cash Flow
As of
For the first quarter of 2018, cash provided by operating activities of continuing operations was
During the first quarter of 2018, the Company paid a quarterly cash dividend of
Outlook (5)
"I am encouraged by the progress we've made so far this year to strengthen our core businesses and expand the service and subscription offerings to our B2B and business-minded customers," said
Due to the favorable results achieved in the first quarter of 2018, the Company is increasing its 2018 full-year outlook for sales, adjusted operating income and free cash flow.
| 2018 Full-Year Outlook (5) | Prior Outlook | Change | Updated Outlook | ||||||||||||
| Sales | ~ $10.6 billion | + $200 million | ~ $10.8 billion | ||||||||||||
| Adjusted Operating Income | ~ $350 million | + $10 million | ~ $360 million | ||||||||||||
| Free Cash Flow | ~ $325 million | + $25 million | ~ $350 million | ||||||||||||
Additional details on the updated 2018 outlook, as well as the Company's long-term strategic direction, operating initiatives and capital allocation priorities will be provided at the Investor Day to be held on
(5) The Company's outlook for 2018 included in this release is for continuing operations only and includes non-GAAP measures, such as adjusted operating income, which excludes charges or credits not indicative of core operations, which may include but not be limited to merger integration expenses, restructuring charges, acquisition-related costs, executive transition costs, asset impairments and other significant items that currently cannot be predicted. The exact amount of these charges or credits are not currently determinable, but may be significant. Accordingly, the Company is unable to provide equivalent reconciliations from GAAP to non-GAAP for these financial measures.
About
FORWARD LOOKING STATEMENTS
This communication may contain forward-looking statements within the meaning of the Private Securities Litigation Reform Act of 1995. These statements or disclosures may discuss goals, intentions and expectations as to future trends, plans, events, results of operations, cash flow or financial condition, or state other information relating to, among other things,
Factors that could cause actual results to differ materially from those in the forward-looking statements include, among other things, the risk that
OFFICE DEPOT, INC. | ||||||||||||
| 13 Weeks Ended | ||||||||||||
| March 31, 2018 | April 1, 2017 | |||||||||||
| Sales: | ||||||||||||
| Products | $ | 2,423 | $ | 2,460 | ||||||||
| Services | 407 | 216 | ||||||||||
| Total Sales | 2,830 | 2,676 | ||||||||||
| Cost of goods sold and occupancy costs: | ||||||||||||
| Products | 1,891 | 1,878 | ||||||||||
| Services | 272 | 123 | ||||||||||
| Total Cost of goods sold and occupancy costs | 2,163 | 2,001 | ||||||||||
| Gross profit | 667 | 675 | ||||||||||
| Selling, general and administrative expenses | 573 | 531 | ||||||||||
| Merger and restructuring expenses, net | 17 | 20 | ||||||||||
| Operating income | 77 | 124 | ||||||||||
| Other income (expense): | ||||||||||||
| Interest income | 6 | 6 | ||||||||||
| Interest expense | (29 | ) | (13 | ) | ||||||||
| Other income, net | 1 | 4 | ||||||||||
| Income from continuing operations before income taxes | 55 | 121 | ||||||||||
| Income tax expense | 22 | 47 | ||||||||||
| Net income from continuing operations | 33 | 74 | ||||||||||
| Discontinued operations, net of tax | 8 | 42 | ||||||||||
| Net income | $ | 41 | $ | 116 | ||||||||
| Basic earnings per common share | ||||||||||||
| Continuing operations | $ | 0.06 | $ | 0.14 | ||||||||
| Discontinued operations | 0.01 | 0.08 | ||||||||||
| Net basic earnings per common share | $ | 0.07 | $ | 0.22 | ||||||||
| Diluted earnings per common share | ||||||||||||
| Continuing operations | $ | 0.06 | $ | 0.14 | ||||||||
| Discontinued operations | 0.01 | 0.08 | ||||||||||
| Net diluted earnings per common share | $ | 0.07 | $ | 0.22 | ||||||||
| Dividends per common share | $ | 0.025 | $ | 0.025 | ||||||||
OFFICE DEPOT, INC. | ||||||||||||
March 31, 2018 | December 30, 2017 | |||||||||||
| ASSETS | ||||||||||||
| Current assets: | ||||||||||||
| Cash and cash equivalents | $ | 737 | $ | 622 | ||||||||
| Receivables, net | 942 | 931 | ||||||||||
| Inventories | 1,033 | 1,093 | ||||||||||
| Prepaid expenses and other current assets | 118 | 86 | ||||||||||
| Current assets of discontinued operations | 98 | 139 | ||||||||||
| Total current assets | 2,928 | 2,871 | ||||||||||
| Property and equipment, net | 713 | 725 | ||||||||||
| Goodwill | 882 | 851 | ||||||||||
| Other intangible assets, net | 448 | 448 | ||||||||||
| Timber notes receivable | 858 | 863 | ||||||||||
| Deferred income taxes | 295 | 305 | ||||||||||
| Other assets | 266 | 260 | ||||||||||
| Total assets | $ | 6,390 | $ | 6,323 | ||||||||
| LIABILITIES AND STOCKHOLDERS' EQUITY | ||||||||||||
| Current liabilities: | ||||||||||||
| Trade accounts payable | $ | 969 | $ | 892 | ||||||||
| Accrued expenses and other current liabilities | 1,011 | 986 | ||||||||||
| Income taxes payable | 6 | 5 | ||||||||||
| Short-term borrowings and current maturities of long-term debt | 93 | 96 | ||||||||||
| Current liabilities of discontinued operations | 27 | 67 | ||||||||||
| Total current liabilities | 2,106 | 2,046 | ||||||||||
| Deferred income taxes and other long-term liabilities | 331 | 336 | ||||||||||
| Pension and postretirement obligations, net | 90 | 91 | ||||||||||
| Long-term debt, net of current maturities | 918 | 936 | ||||||||||
| Non-recourse debt | 770 | 776 | ||||||||||
| Total liabilities | 4,215 | 4,185 | ||||||||||
| Commitments and contingencies | ||||||||||||
| Redeemable noncontrolling interest | 18 | 18 | ||||||||||
| Stockholders' equity: | ||||||||||||
| Common stock — authorized 800,000,000 shares of $.01 par value; issued shares — 614,216,218 at March 31, 2018 and 610,353,994 at December 30, 2017 | 6 | 6 | ||||||||||
| Additional paid-in capital | 2,697 | 2,711 | ||||||||||
| Accumulated other comprehensive loss | (64 | ) | (78 | ) | ||||||||
| Accumulated deficit | (236 | ) | (273 | ) | ||||||||
| Treasury stock, at cost — 56,369,637 shares at March 31, 2018 and December 30, 2017 | (246 | ) | (246 | ) | ||||||||
| Total stockholders' equity | 2,157 | 2,120 | ||||||||||
| Total liabilities, redeemable noncontrolling interest and stockholders' equity | $ | 6,390 | $ | 6,323 | ||||||||
OFFICE DEPOT, INC. | ||||||||||||
| 13 Weeks Ended | ||||||||||||
| March 31, 2018 | April 1, 2017 | |||||||||||
| Cash flows from operating activities of continuing operations: | ||||||||||||
| Net income | $ | 41 | $ | 116 | ||||||||
| Income from discontinued operations, net of tax | 8 | 42 | ||||||||||
| Net income from continuing operations | 33 | 74 | ||||||||||
| Adjustments to reconcile net income to net cash provided by operating activities: | ||||||||||||
| Depreciation and amortization | 51 | 40 | ||||||||||
| Charges for losses on inventories and receivables | 14 | 18 | ||||||||||
| Compensation expense for share-based payments | 4 | 11 | ||||||||||
| Deferred income taxes and deferred tax asset valuation allowances | 19 | 35 | ||||||||||
| Changes in working capital and other | 86 | (90 | ) | |||||||||
| Net cash provided by operating activities of continuing operations | 207 | 88 | ||||||||||
| Cash flows from investing activities of continuing operations: | ||||||||||||
| Capital expenditures | (37 | ) | (30 | ) | ||||||||
| Businesses acquired, net of cash acquired | (30 | ) | — | |||||||||
| Proceeds from disposition of assets and other | 1 | 8 | ||||||||||
| Net cash used in investing activities of continuing operations | (66 | ) | (22 | ) | ||||||||
| Cash flows from financing activities of continuing operations: | ||||||||||||
| Net payments on long and short-term borrowings | (25 | ) | (6 | ) | ||||||||
| Debt related fees | (1 | ) | — | |||||||||
| Cash dividends on common stock | (14 | ) | (13 | ) | ||||||||
| Share purchases for taxes, net of proceeds from employee share-based transactions | (3 | ) | (9 | ) | ||||||||
| Repurchase of common stock for treasury | — | (10 | ) | |||||||||
| Other financing activities | 2 | — | ||||||||||
| Net cash used in financing activities of continuing operations | (41 | ) | (38 | ) | ||||||||
| Cash flows from discontinued operations: | ||||||||||||
| Operating activities of discontinued operations | 10 | 14 | ||||||||||
| Investing activities of discontinued operations | 30 | (49 | ) | |||||||||
| Net cash provided by (used in) discontinued operations | 40 | (35 | ) | |||||||||
| Effect of exchange rate changes on cash and cash equivalents | (2 | ) | 2 | |||||||||
| Net increase (decrease) in cash and cash equivalents | 138 | (5 | ) | |||||||||
| Cash, cash equivalents and restricted cash at beginning of period | 639 | 807 | ||||||||||
| Cash, cash equivalents and restricted cash at end of period - total | 777 | 802 | ||||||||||
| Cash and cash equivalents of discontinued operations | (37 | ) | (58 | ) | ||||||||
| Cash, cash equivalents and restricted cash at end of the period – continuing operations | $ | 740 | $ | 744 | ||||||||
GAAP to Non-GAAP Reconciliations
(Unaudited)
We report our results in accordance with accounting principles generally accepted in
Our measurement of these non-GAAP financial measures may be different from similarly titled financial measures used by others and therefore may not be comparable. These non-GAAP financial measures should not be considered superior to the GAAP measures, but only to clarify some information and assist the reader. We have included reconciliations of this information to the most comparable GAAP measures in the tables included within this material.
The Company's outlook for 2018 adjusted operating income excludes charges or credits not indicative of our core operations, which may include but not be limited to merger integration expenses, restructuring charges, asset impairments, and other significant items that currently cannot be predicted. The exact amount of these charges or credits are not currently determinable, but may be significant. Accordingly, the company is unable to provide a reconciliation to an equivalent operating income outlook for 2018.
(In millions, except per share amounts) | ||||||||||||||||||||||||||||||||||
Q1 2018 | Reported (GAAP) | % of Sales | Less: Charges & Credits | Adjusted (Non-GAAP) | % of Sales | |||||||||||||||||||||||||||||
| Selling, general and administrative expenses | $ | 573 | 20.2 | % | $ | — | $ | 573 | 20.2 | % | ||||||||||||||||||||||||
| Merger and restructuring expenses, net | $ | 17 | 0.6 | % | $ | 17 | $ | — | — | % | ||||||||||||||||||||||||
| Operating income (loss) | $ | 77 | 2.7 | % | $ | (17 | ) | $ | 93 | 3.3 | % | |||||||||||||||||||||||
| Income tax expense (benefit) | $ | 22 | 0.8 | % | $ | (4 | ) | $ | 26 | 0.9 | % | |||||||||||||||||||||||
| Net income (loss) from continuing operations | $ | 33 | 1.2 | % | $ | (13 | ) | $ | 45 | 1.6 | % | |||||||||||||||||||||||
| Earnings (loss) per share (most dilutive) | $ | 0.06 | $ | (0.02 | ) | $ | 0.08 | |||||||||||||||||||||||||||
| Q1 2017 | Reported (GAAP) | % of Sales | Less: Charges & Credits | Adjusted (Non-GAAP) | % of Sales | |||||||||||||||||||||||||||||
| Selling, general and administrative expenses | $ | 531 | 19.8 | % | $ | 4 | $ | 527 | 19.7 | % | ||||||||||||||||||||||||
| Merger and restructuring expenses, net | $ | 20 | 0.7 | % | $ | 20 | $ | — | — | % | ||||||||||||||||||||||||
| Operating income (loss) | $ | 124 | 4.6 | % | $ | (24 | ) | $ | 148 | 5.5 | % | |||||||||||||||||||||||
| Income tax expense (benefit) | $ | 47 | 1.8 | % | $ | (10 | ) | $ | 57 | 2.1 | % | |||||||||||||||||||||||
| Net income (loss) from continuing operations | $ | 74 | 2.8 | % | $ | (14 | ) | $ | 88 | 3.3 | % | |||||||||||||||||||||||
| Earnings (loss) per share (most dilutive) | $ | 0.14 | $ | (0.03 | ) | $ | 0.16 | |||||||||||||||||||||||||||
OFFICE DEPOT, INC. | ||||||||||||||||||||
| Q1 2018 | Q1 2017 | |||||||||||||||||||
| North American Retail (NAR): | ||||||||||||||||||||
| Stores opened | — | — | ||||||||||||||||||
| Stores closed | 2 | 2 | ||||||||||||||||||
| Total NAR (U.S.) stores | 1,376 | 1,439 | ||||||||||||||||||
| Total NAR square footage (in millions) | 31.0 | 32.4 | ||||||||||||||||||
| Average square footage per store (in thousands) | 22.5 | 22.5 | ||||||||||||||||||
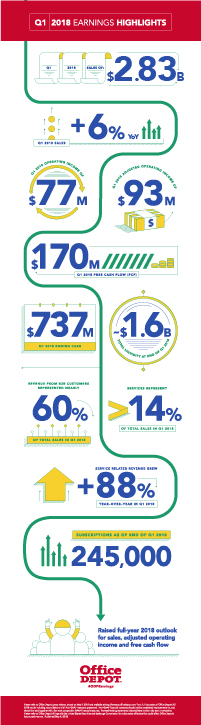
Q1 2018 Earnings Highlights
View source version on businesswire.com: https://www.businesswire.com/news/home/20180509005113/en/
Source:
Office Depot, Inc.
Investor Relations:
Richard Leland, 561-438-3796
Richard.Leland@officedepot.com
or
Media Relations:
Danny Jovic, 561-438-1594
Danny.Jovic@officedepot.com